Debugging
LibOSDP has a lot of debugging/diagnostics built into it to help narrow down the issue without having to exchange a bunch of emails/comments with each user who encounters an issue. This save developer time at both ends. That said, the default logging methods are very sane which makes this unnecessary for every issue. So don’t trouble yourself to generate such logs proactively.
A note on the log file
It is preferable to attach the full logs (from osdp_cp_setup() to point of failure). If you feel that you know what the issue is or that the entire log wont help, please feel free to snip them as you see fit, but please try to retain the very first few log lines as it has some info on which version of LibOSDP you are running and you PD connection topology.
When creating an issue in GitHub, it is not very elegant to post the entire log file in the issue description so it is better to attached the log file to the issue or post it in some log sharing websites such as https://pastebin.com/ and include the link in the issue.
Log Level
LibOSDP supports different logging levels with LOG_DEBUG being the most
verbose mode. When asking for help, please set the log level to LOG_DEBUG.
This can be done by calling osdp_logger_init() BEFORE calling osdp_cp/pd_setup() as,
osdp_logger_init("osdp::cp", LOG_DEBUG, uart_puts);
Any log messages emitted by LibOSDP other than DEBUG and INFO should be treated out-of-ordinary (cues for action).
Packet Trace Builds
This is the most verbose form of debugging where all bytes on the wire are captured and stored to a .pcap file which can then be inspected with WireShark. This can come in handy when trying to debug low level issues.
To enable packet trace builds, follow these steps:
mkdir build-pt && cd build-pt
cmake -DOPT_OSDP_PACKET_TRACE=on ..
make
During CP/PD setup, you must set PD info flag OSDP_FLAG_CAPTURE_PACKETS. After this when you run your application, libosdp will produce a .pcap file int the current directory which contains all the packets it decoded from the communication channel.
Data Trace Builds
When secure channel is working fine and you are encountering a command level failure, it can be helpful to see the decrypted messages instead of the junk that would get dumped when secure channel is enabled. This option dumps the packet just after it was built/decrypted.
To enable data trace builds, follow these steps:
mkdir build-dt && cd build-dt
cmake -DOPT_OSDP_DATA_TRACE=on ..
make
During CP/PD setup, you must set PD info flag OSDP_FLAG_CAPTURE_PACKETS. After this when you run your application, libosdp will produce a .pcap file in the current directory which contains all the packets it decoded from the communication channel.
Note: It is seldom useful to run on both packet trace AND data trace (in fact it makes it harder to locate relevant information) so please never do it.
WireShark Payload Dissector
To view the captured packets (see above), as an one time setup, we must first setup WireShark with a custom protocol dissector.
mkdir -p $HOME/.local/lib/wireshark/plugins
cp path/to/libosdp/misc/osdp_dissector.lua $HOME/.local/lib/wireshark/plugins/
Note: For Windows, osdp_disector.lua needs to be copied to %APPDATA%Wiresharkplugins
For the dissector to be loaded, you should restart Wireshark it’s running. Then from the GUI, goto,
Preference -> Protocols -> DLT_USER -> Encapsulations Table -> Edit
In the new window that popped-up, click the “+” button to add a new row and then chose the following:
DLT: User 15 (DLT=162)
Payload Dissector: osdp
Header size: 0
Trailer size: 0
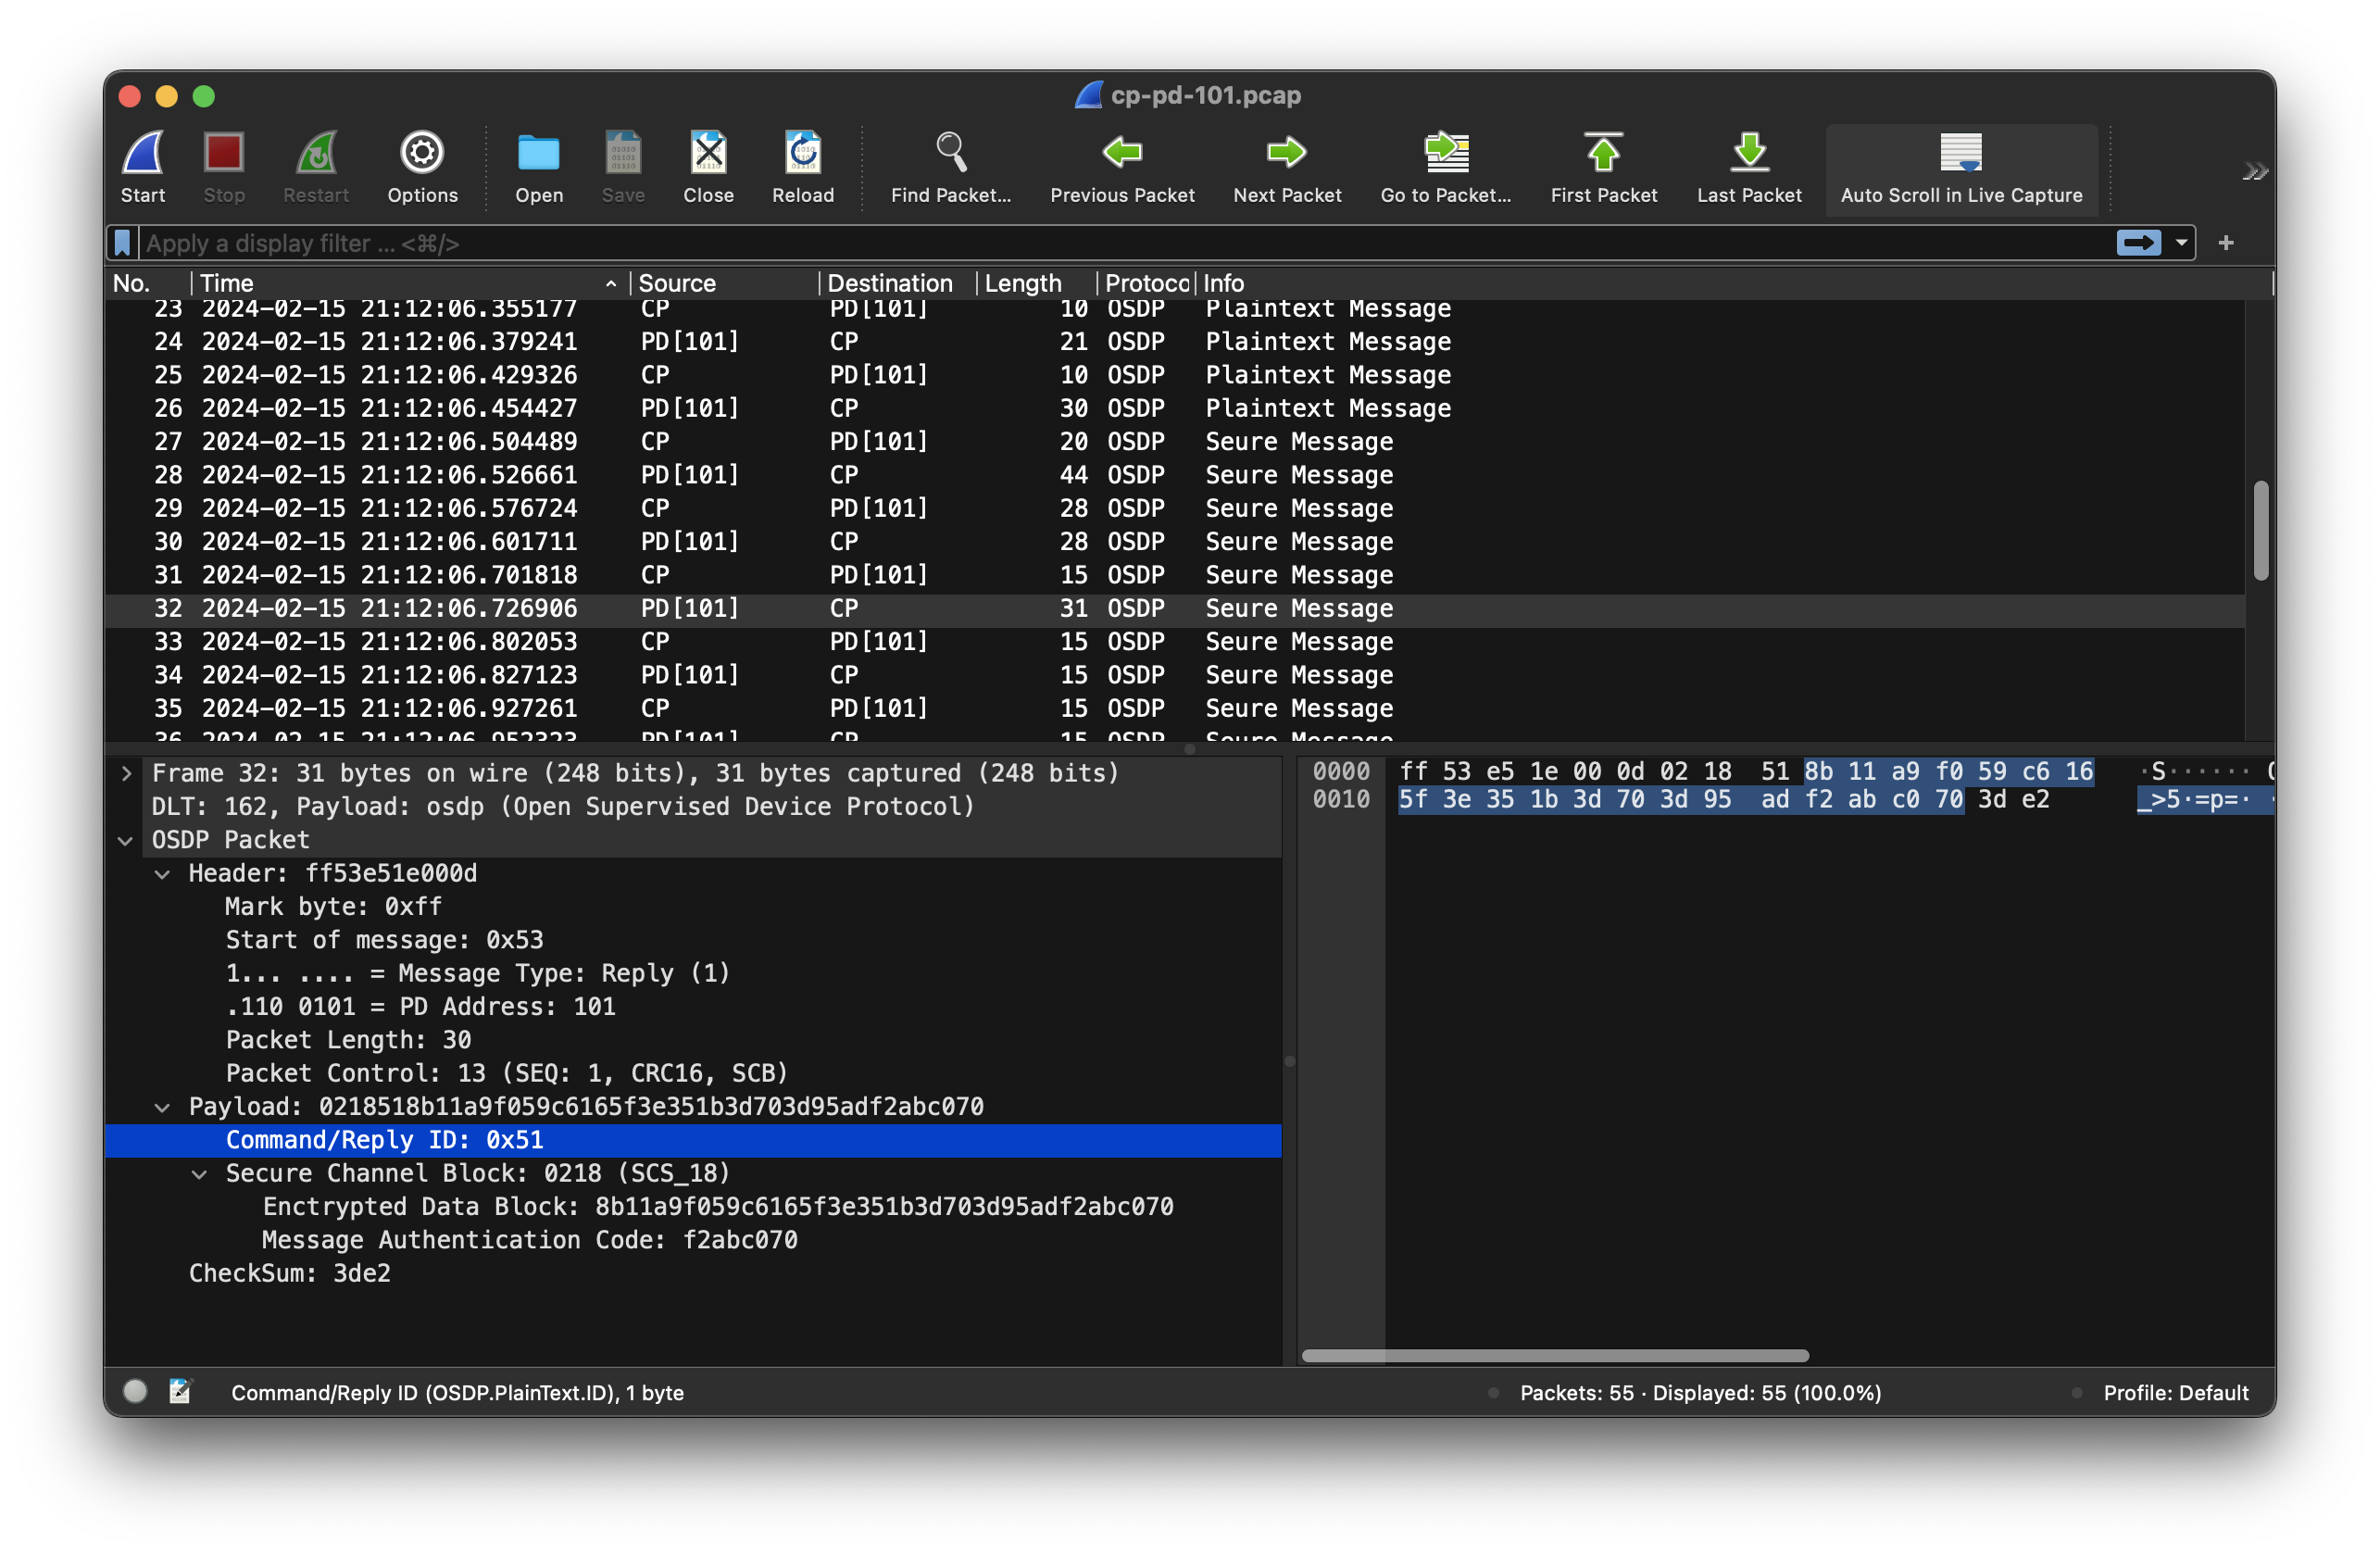
After that, you can do File -> Open and choose the the .pcap files that were produced by LibOSDP build when PACKET_TRACE enabled. Here is a screenshot of what you can expect to see: